

Economic Data
Ontairo’s Ring of Fire in Northern Ontario is a globally significant mineral zone with the potential to reshape Canada’s mining economy. It holds vast deposits of nickel, chromite, copper, and platinum group elements—minerals essential to the green economy and advanced manufacturing. Unlike many opinion pieces, this page focuses on verified data, market benchmarks, and projected returns to provide a full picture of the region’s economic promise.
This page delivers key economic data, infrastructure cost projections, mineral market trends, and mining development forecasts that go beyond opinion and into hard numbers.
Table of Contents
- Key Economic Data Indicators
- Capital Investment Breakdown (Projected)
- Global Mineral Economics (2025 Data)
- Ring of Fire vs Global Mineral Output Potential (Estimates)
- Critical Mineral Profiles from the Ring of Fire
- Mining Economic Data Benchmarks
- Timeline of Major Milestones
- Top 5 Economic Data Drivers in the Ring of Fire
- Fun Facts
- Recent News
 Photo by Google Deepmind on Unsplash
Key Economic Data Indicators
Economic Data Value
Ontario’s Ring of Fire has the potential to deliver transformational economic impacts. From resource value to job creation, these key economic data figures show how this region compares to other major mineral zones.
| Indicator | Value |
|---|---|
| Estimated Mineral Value | $60 billion+ |
| Total Projected Infrastructure Cost | $2.4 billion (roads, power, telecom) |
| Expected Job Creation | 5,000+ direct, 10,000+ indirect |
| Potential Annual Tax Revenue | $1.5 billion (Fed + Prov) |
| Ring of Fire Area | ~5,000 km² |
| Years of Economic Activity | 30+ years projected |
Capital Investment Breakdown (Projected)
Strategic Investments
Strategic infrastructure and early investment in the Ring of Fire will lay the groundwork for decades of resource development. Here’s how public and private capital is expected to be allocated, based on economic data.
| Sector | Estimated Investment |
|---|---|
| Road Construction (Northern Link, Supply Road) | $1.6 billion |
| Transmission Line & Power Infrastructure | $600 million |
| Environmental Assessments & Permitting | $100 million+ |
| Camp Development & Logistics | $120 million |
| Indigenous Training & Capacity Programs | $75 million |
Global Mineral Economics (2025 Data)
Critical Mineral Global Demand Growth
Global market conditions will shape the long-term value of Ontario’s mineral assets. These economic data benchmark figures show the rising global demand for strategic minerals, positioning the Ring of Fire as a key Canadian export hub.
| Mineral | Global Demand Growth (2024–2030) | Avg. Market Price (2025 USD/tonne) |
|---|---|---|
| Nickel | +38% (driven by EV batteries) | $21,000 |
| Copper | +22% | $8,500 |
| Chromite | +18% | $290 |
| Platinum Group Metals (PGMs) | +15% | $31,000 (combined) |
| Lithium (benchmark) | +40% | $28,000 |
Ring of Fire vs Global Mineral Output Potential (Estimates)
Critical Mineral Global Comparisons
Compared to global mining regions, the Ring of Fire holds small but high-grade reserves that are critical to North America’s supply chain independence. These economic data estimates underscore its strategic rather than bulk economic role.
| Mineral | Ring of Fire Potential Output (tonnes/year) | Global Output (2025 est.) | RoF % of Global |
|---|---|---|---|
| Nickel | 30,000–50,000 | 3,000,000 | 1–1.7% |
| Chromite | 1,000,000 | 30,000,000 | 3.3% |
| Copper | 20,000 | 22,000,000 | 0.09% |
| PGMs | 5,000 (combined) | 450,000 | 1.1% |
Critical Mineral Profiles from the Ring of Fire
Ontario Ring of Fire Critical Minerals
Ontario’s mineral strategy is anchored in high-demand, future-facing resources. These profiles break down the individual economic data behind the four most valuable assets in the region.
Nickel
| Indicator | Value |
|---|---|
| Avg. Price (2025) | $21,000/tonne |
| RoF Est. Output | 30,000–50,000 tonnes/year |
| Projected Revenue | $630M–$1.05B annually |
Chromite
| Indicator | Value |
|---|---|
| Avg. Price (2025) | $290/tonne |
| RoF Est. Output | 1M tonnes/year |
| Projected Revenue | $290M annually |
Copper
| Indicator | Value |
|---|---|
| Avg. Price (2025) | $8,500/tonne |
| RoF Est. Output | 20,000 tonnes/year |
| Projected Revenue | $170M annually |
PGMs
| Indicator | Value |
|---|---|
| Avg. Price (2025) | $31,000/tonne |
| RoF Est. Output | 5,000 tonnes/year |
| Projected Revenue | $155M annually |
Mining Economic Data Benchmarks
Understanding how the Ring of Fire compares to mining operations worldwide helps assess its viability. These economic data industry benchmarks show where Ontario’s remote mining corridor fits into the global picture.
| Category | Industry Benchmark | RoF Context |
|---|---|---|
| CapEx per tonne mined | $60–$150 | Likely on higher end due to remoteness |
| ROI over mine life | 8–15% | Expected 10%+ for nickel assets |
| Opex (all-in sustaining costs) | $8,000/tonne (nickel avg.) | To be confirmed post-feasibility |
| Time from discovery to production | 10–12 years avg. | RoF: >15 years due to infrastructure & permitting |
Timeline of Major Milestones
Timeline
Ontario’s path to realizing the Ring of Fire has been shaped by evolving infrastructure, policy, and corporate activity. This timeline highlights key turning points over nearly two decades of development.
| Year | Milestone |
|---|---|
| 2007 | Major discoveries by Noront Resources |
| 2014 | Infrastructure planning starts |
| 2021 | EA filed for road access |
| 2023 | Wyloo acquires Noront |
| 2024–25 | Construction phase |
| 2028–2030 | First mine output projected |
Top 5 Economic Data Drivers in the Ring of Fire
- Nickel for Batteries & EVs
Global demand is surging due to electric vehicle growth. The Ring of Fire’s nickel reserves are vital to Canada’s battery supply chain goals. - Chromite for Stainless Steel
With the only known North American chromite reserves of this scale, Ontario is poised to become a key supplier to domestic and international steel producers. - Infrastructure Expansion
Roads, transmission lines, and airstrips not only support mining but improve economic access and connectivity for remote Indigenous communities. - Indigenous Economic Participation
First Nations are leading environmental assessments, logistics companies, and impact benefit negotiations—creating real ownership and long-term value. - Export Potential
With proximity to the U.S. and global markets, the Ring of Fire could become a secure supplier of ethically sourced critical minerals to Europe, Asia, and North America.
Economic Data Sources
[1] Ontario Chamber of Commerce
[2] Mining Association of Canada Reports
[3] Northern Road Link EA Documents
[4] Government of Ontario Economic Outlooks
[5] Parliamentary Budget Office Estimates
[6] Natural Resources Canada GIS Data
[7] Noront/Wyloo Company Filings
[8] IESO Northern Ontario Transmission Plans
[9] CEAA Environmental Impact Guidelines
[10] Ring of Fire Infrastructure Development Corp.
[11] FedNor and NOHFC training grant documents
[12] Nickel Institute, 2025 Market Outlook
[13] London Metal Exchange copper pricing
[14] USGS Global Chromite Reports
[15] World Platinum Investment Council
[16] Benchmark Mineral Intelligence
[17] Macquarie Commodities Research
[18] EY Global Mining & Metals Benchmarking
Fun Facts
- Rail Access Revival: The Ontario Northland rail corridor may see its first expansion in decades due to RoF demand.
- Satellite Over Muskeg: Mining firms have used drone mapping and LEO satellites to assess RoF geology.
- Portable Smelters: Designs are underway for mobile ore processors to reduce environmental impact.
- Gold Isn’t the Only Prize: Though less discussed, parts of RoF show gold and rare earth mineral traces.
- Camp Meals Matter: Ontario mining camps spend over $12 million annually on food and kitchen logistics alone.

This isn’t just a mine—it’s an engine for 21st-century economic renewal.
Pierre Gratton, President, Mining Association of Canada

Recent News
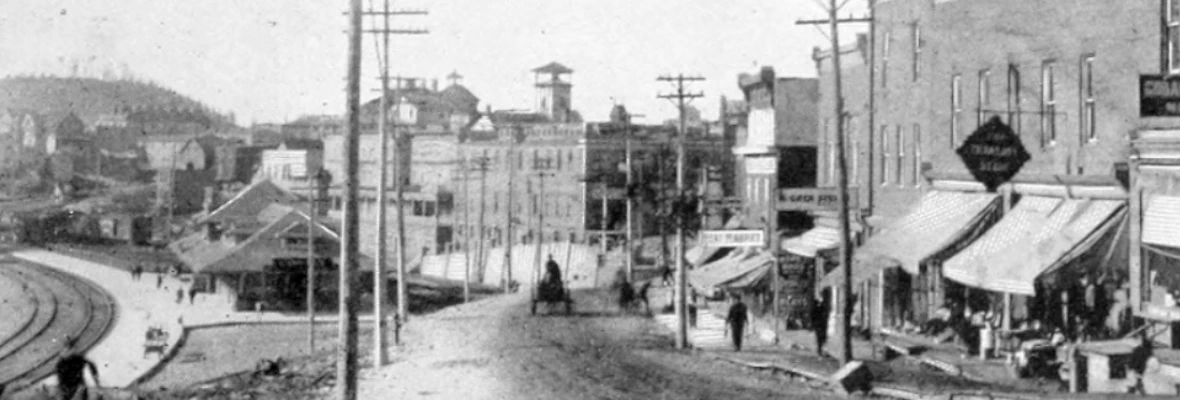
6 Fun Facts About Old Cobalt Ontario Mines
Beneath the quiet streets of Cobalt lies a story that once shook global markets. The...
Read More
Airplane Critical Minerals: 5 of Canada’s Strategic Ro...
Canada’s vast mineral wealth is not just an economic asset—it’s a strategic advantage in the...
Read More
$100 Billion Future: First Nations Construction Companies Sh...
First Nations Construction Companies are carving out a powerful role in Canada’s economy. With a...
Read More
Mining Drones Revolution: 6 Ways Fixing Old School Mindsets
Mining drones are rewriting the field guide—literally. These flying machines have evolved from flashy toys...
Read More